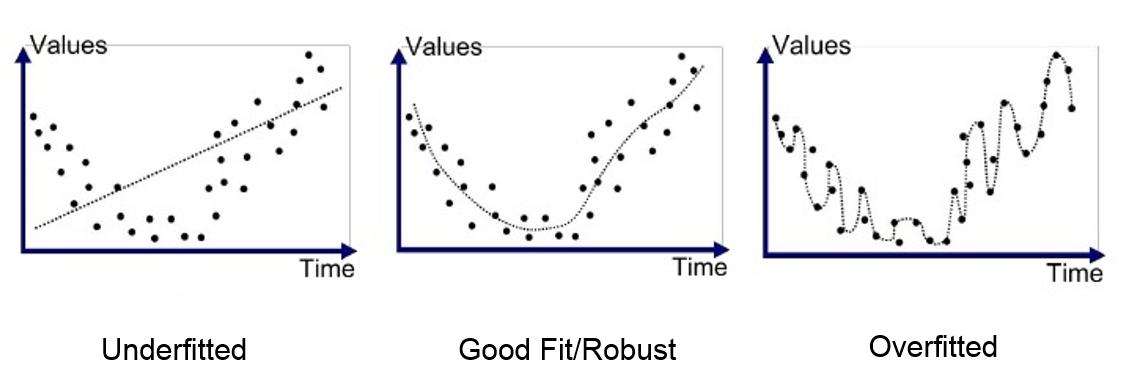
Code
library(tidyverse)
library(ggpubr)
library(qqplotr)
library(janitor)Transformaciones y predictoras categóricas
library(tidyverse)
library(ggpubr)
library(qqplotr)
library(janitor)datos <- read_csv("datos/Discovery Farms Dataset.csv") |>
select(Crop, Soil_Condition, Soil_pH_6, Precip_Frozen, `Precip_Non-frozen`, Load_DP) |>
clean_names() |>
filter(load_dp > 0)
datos |> head()datos$load_dp |>
ggqqplot()
datos$load_dp |>
  log() |>
  ggqqplot()
datos |>
  ggplot(aes(x = soil_p_h_6, y = load_dp)) +
  geom_point() +
  geom_smooth(method = "lm", se = FALSE)
datos |>
  ggplot(aes(x = soil_p_h_6, y = load_dp)) +
  geom_point() +
  scale_y_log10() +
  scale_x_log10() +
  geom_smooth(method = "lm", se = FALSE)
datos |>
  ggplot(aes(x = crop, y = load_dp)) +
  geom_boxplot()
datos |>
  ggplot(aes(x = soil_condition, y = load_dp)) +
  geom_boxplot()
datos |>
  ggplot(aes(x = crop, y = load_dp)) +
  geom_boxplot() +
  scale_y_log10()
datos |>
  ggplot(aes(x = soil_condition, y = load_dp)) +
  geom_boxplot() +
  scale_y_log10()
datos |>
  ggplot(aes(x = crop, y = load_dp)) +
  facet_wrap(~soil_condition) +
  geom_boxplot()
datos |>
  ggplot(aes(x = crop, y = load_dp)) +
  facet_wrap(~soil_condition) +
  geom_boxplot() +
  scale_y_log10()
datos |>
  group_by(crop) |>
  reframe(promedio = mean(load_dp),
          minimo = min(load_dp),
          maximo = max(load_dp),
          desviacion = sd(load_dp),
coef_var = (desviacion / promedio) * 100)datos |>
mutate(log_load_dp = log(load_dp)) |>
group_by(crop) |>
reframe(promedio = mean(log_load_dp, na.rm = TRUE),
mediana = median(log_load_dp, na.rm = TRUE),
desviacion = sd(log_load_dp)) |>
mutate(
promedio = exp(promedio),
desviacion = exp(desviacion),
mediana = exp(mediana),
coef_var = (desviacion / promedio) * 100
)modelo_ori <- lm(load_dp ~ crop, data = datos)
modelo_ori |> summary()
Call:
lm(formula = load_dp ~ crop, data = datos)

Residuals:
   Min     1Q Median     3Q    Max
-839.2 -346.6 -218.3   26.4 5288.2

Coefficients:
            Estimate Std. Error t value Pr(>|t|)
(Intercept)   227.13     156.94   1.447  0.14918
cropcorn      189.67     174.26   1.088  0.27754
cropforage     82.87     206.25   0.402  0.68820
croppasture   614.04     201.51   3.047  0.00258 **
cropsoy       221.44     199.46   1.110  0.26807
---
Signif. codes:  0 '***' 0.001 '**' 0.01 '*' 0.05 '.' 0.1 ' ' 1

Residual standard error: 768.8 on 231 degrees of freedom
Multiple R-squared:  0.05279,   Adjusted R-squared:  0.03639
F-statistic: 3.218 on 4 and 231 DF, p-value: 0.01351modelo_log <- lm(log(load_dp) ~ crop, data = datos)
modelo_log |> summary()
Call:
lm(formula = log(load_dp) ~ crop, data = datos)

Residuals:
   Min     1Q Median     3Q    Max
-5.115 -0.863  0.137  1.151  3.865

Coefficients:
            Estimate Std. Error t value Pr(>|t|)
(Intercept)  4.84728    0.35338  13.717   <2e-16 ***
cropcorn    -0.06289    0.39240  -0.160   0.8728
cropforage  -0.23586    0.46444  -0.508   0.6121
croppasture  0.96111    0.45375   2.118   0.0352 *
cropsoy      0.23965    0.44914   0.534   0.5942
---
Signif. codes:  0 '***' 0.001 '**' 0.01 '*' 0.05 '.' 0.1 ' ' 1

Residual standard error: 1.731 on 231 degrees of freedom
Multiple R-squared:  0.0477,    Adjusted R-squared:  0.03121
F-statistic: 2.893 on 4 and 231 DF, p-value: 0.023matriz_dis <-
model.matrix(load_dp ~ crop, data = datos)
matriz_dis |> head() (Intercept) cropcorn cropforage croppasture cropsoy
1 1 1 0 0 0
2 1 0 0 0 0
3 1 0 0 0 1
4 1 1 0 0 0
5 1 1 0 0 0
6 1 0 0 0 1\[\hat{y} = 227.13 + (\beta1 \times corn_i) + (\beta2 \times forage_i) + (\beta3 \times pasture_i) + (\beta4 \times soy_i) + \epsilon_i\]
ejemplo_prediccion <- datos |>
  slice(73)

predict(object = modelo_ori, newdata = ejemplo_prediccion)
1
310 \[\hat{y} = 227.13 + (189.67 \times 0) + (82.87 \times 1) + (614.04 \times 0) + (221.44 \times 0)\]
227.13 + (82.87 * 1)[1] 310


rsample: remuestreolibrary(rsample)
# Declarar la partición inicial
set.seed(2024)
particion <- initial_split(data = datos, prop = 0.70, strata = "crop")
# Extrear los conjuntos de train-test
datos_train <- training(particion)
datos_test <- testing(particion)recipes: preprocesadolibrary(recipes)
receta <- recipe(load_dp ~ soil_p_h_6, data = datos_train) |>
step_impute_median(soil_p_h_6)
# Verificamos que no haya datos con NA en train
receta |>
prep() |>
bake(new_data = datos_train)receta |>
prep() |>
bake(new_data = datos_test)parsnip: modelolibrary(parsnip)
modelo <- linear_reg(engine = "lm")library(workflows)
flujo_modelo <- workflow() |>
add_recipe(receta) |>
add_model(modelo)
flujo_modelo══ Workflow ════════════════════════════════════════════════════════════════════
Preprocessor: Recipe
Model: linear_reg()
── Preprocessor ────────────────────────────────────────────────────────────────
1 Recipe Step
• step_impute_median()
── Model ───────────────────────────────────────────────────────────────────────
Linear Regression Model Specification (regression)
Computational engine: lm ajuste_modelo <- flujo_modelo |>
fit(datos_train)
ajuste_modelo══ Workflow [trained] ══════════════════════════════════════════════════════════
Preprocessor: Recipe
Model: linear_reg()
── Preprocessor ────────────────────────────────────────────────────────────────
1 Recipe Step
• step_impute_median()
── Model ───────────────────────────────────────────────────────────────────────
Call:
stats::lm(formula = ..y ~ ., data = data)
Coefficients:
(Intercept) soil_p_h_6
-1532.4 285.9 predicciones_test <- predict(object = ajuste_modelo, new_data = datos_test)
predicciones_testyardstick: evaluaciónlibrary(yardstick)
predicciones_train <- predict(object = ajuste_modelo, new_data = datos_train)
rmse_vec(truth = datos_train$load_dp,
estimate = predicciones_train$.pred)[1] 722.0435rmse_vec(truth = datos_test$load_dp,
estimate = predicciones_test$.pred)[1] 859.2727